
Table of content
Every payout operations team has a version of this story.
A payout batch runs on Friday. By Monday morning, a percentage of those payments have returned. By Tuesday, the ops team is working through exception reports: manually re-routing failed payments, contacting recipients to confirm bank details, and triggering re-runs. Some of those payments won’t land until Thursday.
Across industries, the impact on the bottom line is noticeable:
- For payroll and vendor payments, delayed salaries or vendor payouts drive HR escalations, vendor friction, and recurring “war rooms” every pay cycle.
- For marketplaces and creator platforms, each failed payout becomes a reason for sellers to try another platform.
- For fintech and remittance providers, failed payouts introduce FX losses, increase compliance exposure, and reduce payment success rates.
The common thread? These types of data-related failures are preventable.
This guide covers how payout failures occur, what they really cost global businesses, and how to design a prevention-first approach without rebuilding your payout stack.
Why payouts fail
Most payout failures aren’t caused by broken systems. They’re the result of bad data.
A payee name that doesn’t match the account holder. An outdated routing code that has expired. An account number for a dormant or frozen account that gets rejected.
All are simple mistakes with a simple solution — a verification check run pre-payment. Yet many global teams continue to struggle with inadequate verification coverage.
This guide shares how to design a prevention-first approach that catches mismatches and flags them before they cause issues, all without having to rebuild your stack.
Top causes of payout failure
According to industry data, just ~10-15% of payout returns are caused by network, bank-side, or currency mismatch issues.
The rest are the result of preventable errors:
- Wrong or closed account numbers, ~30-35%
- Invalid routing code / sort code / IFSC, ~15-20%
- Name mismatch, i.e. payee name ≠ account holder name, ~10-15%
- Dormant or frozen account, ~10%
- Compliance reject, ~5-10%
Most payout failures are caused by bad data, not broken systems
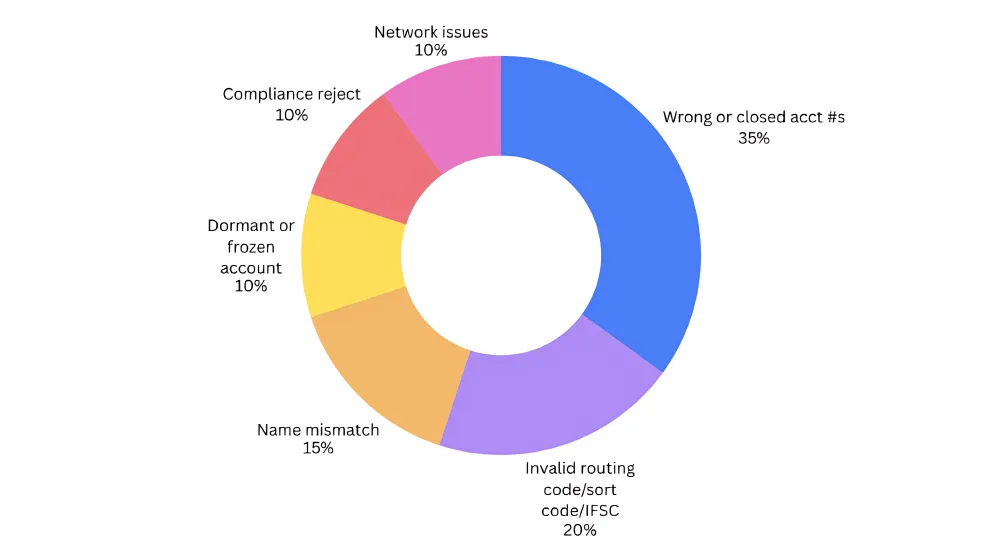
Nium's own payout network consistently shows the same pattern. According to our data, 77% of all payment returns are attributable to incorrect or closed account numbers and name mismatches alone.
How bad account data enters payout systems
There are three main channels where bad account data typically enters payout systems:
- Channel #1: Self-submitted details.
Users enter their own bank details during onboarding. Typos, transpositions, and outdated accounts are common — and rarely checked in real time. - Channel #2: Aging payee databases.
Accounts that were valid months ago may no longer be active. Without periodic verification, the database slowly decays. - Channel #3: Fraud and manipulated details.
Payment redirection fraud, where attackers replace legitimate bank details, accounts for billions in losses annually. Many of these attacks succeed because no verification check is performed after details are changed.
What failed payouts really cost
Most teams think of failed payments as a volume problem, accounting for a small percentage of transactions that return and get re-processed.
The actual cost is significantly larger and mostly invisible on the balance sheet.
There are direct costs like re-processing fees, wire recall fees, and FX re-exposure. But they’re also the indirect costs that are harder to quantify: ops team time, customer and payee trust, compliance overhead, and downstream settlement risk.
For a team processing 500 payouts per day at a 1.5% failure rate, generating ~165 exceptions per month at $25 per incident, that’s $4,100 per month in hidden costs.
How payout failure costs impact different industries
- For payroll & vendor payments: Each failed payout is two costs combined—there-runand the internal time spent resolving HR and/orvendor escalations.
- For marketplaces & creator platforms: Support tickets increase the burden on ops, while seller, creator, and partner churn cuts into the bottom line.
- For cross-border fintech & remittance: Corridor-level failure hotspots increase FX noise, compliance RFIs, and regulatory scrutiny in growth markets.
- For banks & financial institutions: Highreturn rates are the #1 reason for unreliable payments and customer dissatisfaction.
The metric that matters most: how many failures are preventable
For account-detail failures, including wrong account numbers, invalid routing codes, name mismatches, closed accounts, the answer is close to 100%.
These are not probabilistic failures. They are deterministic.
Prevention vs. detection: Which is best?
There are two ways to handle payout failure: detection and prevention.
Detection
As the name suggests, detection happens after the fact. Payment gets sent; the payouts team waits for failure and investigates its cause, then re-processes the transaction.
Direct and indirect costs of a detection-first approach include:
- Cost per incident— $15-50 on average, due to ops handling and re-processing.
- Time to resolve — typically hours to days.
- Payee experience— impacts include delayed payment,possible holds.
- Fraud exposure— payment exits system before detection.
- Compliance exposure— potential RFI, reporting obligation.
Prevention
A prevention-first approach seeks to uncover and correct data issues before payment is sent through pre-validation, also referred to as a beneficiary validation or account pre-validation.
During this step, the payment platform confirms that a recipient’s bank account number, routing code, and account holder name are valid and active before releasing a payment.
The check is performed via real-time API call to the verification provider, which returns a status (valid or invalid), failure reason code, and where supported, a name-match score against the bank’s registered account holder name.
Direct and indirect costs of a detection-first approach include:
- Cost per incident — $0.15-0.50 on average with a verification API call.
- Time to resolve — typically seconds, flagged before release.
- Payee experience — proactive correction, no disruption.
- Fraud exposure — mismatch caught beforepaymentleaves.
- Compliance exposure — risk removed before transaction.
The economics of prevention vs. detection are not even close
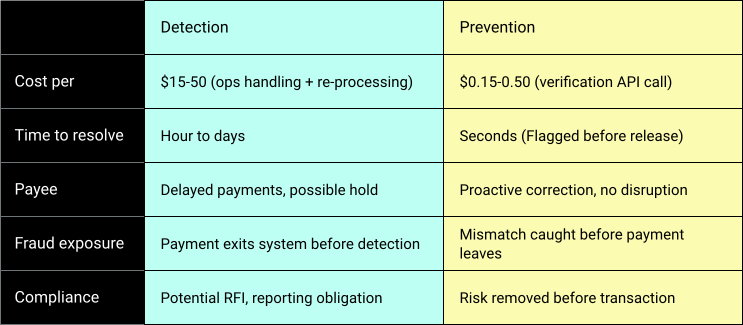
At scale, the cost differential grows even more apparent
Take a payout operation processing 10,000 payments per month for example.
At a 1.5% failure rate, with an average handling cost of $25 per exception, they spend $3,750/month on avoidable exceptions.
If they were to take a prevention-first approach at $0.25 per verification, they would only spend $2,500/month to verify all payments and save the exceptions entirely.
- Projected net savings with pre-validation:
$1,250/month before factoring in FX risk, compliance overhead, or payee experience impact.
How to address payout failures
If your goal is to reduce failed payments, the key question to ask yourself is: Where will you catch bad data before release?
The following steps can help you get an answer:
- Map failure reasons to data issues.
Pull all return code reasons for the last six months.If over 30% are account-detail issues,then you have a preventable failure problem. - Identify all entry points for bank details.
For example,self-serve onboarding, batch uploads, support-initiated changes, and file integrations. - Choose one or more verification triggers.
Onboarding, pre-flight batch runs, webhook on change, or periodic hygiene are great examples. - Decide verification coverage.
Start with high-volume and/or high-failure corridors. - Define routing rules for verification responses.
Auto-approve, block, or send to manual review based on status and name-match score.
Understanding your options
Not all verification methods are equal. Teams evaluating their options typically encounter three approaches.
Trial deposits
Trial deposits, also known as micro-deposits, are two small temporary transactions (typically under $1 each) sent to a bank account to verify the recipient is legitimate.
Because they use the ACH network as their primary payment rail, trial deposits can bebothslow and operationally heavy.
The cons of trial deposits for pre-verification:
- Typically takes 1-3 days
- Requires reconciliation
- No name validation
- Adds onboarding friction
Manual verification
Manual verification usually involves calling a bank, checking documents, and/or using spreadsheets to verify that the bank details provided are correct and genuine.
Because it involves human checkpoints across the workflow, it’s slow, error-prone, and does not scale for global payout teams.
The cons of manual verification for pre-verification:
- Requires human review
- Prone to fraud
- High friction for users
- Breaks at volume
Real-Time API
Real-time API (application programming interface) is a programmatic method that instantly checks and validates a recipient's bank details before payment is sent.
With Nium Verify, for example, details are validated instantly and a standardized response is created to catch issues before they become a payout failure.
Pros of real-time API for pre-verification:
- Real-time response
- No test payments
- Name matching where supported
- Scales across workflows
- Actionable response data
Before choosing an approach, quantify your baseline in two minutes with the ROI calculator.
Four areas to layer in verification
Verification is a lightweight layer that fits into your existing payout workflows — no rebuild required.
It can be added at four key points:
- Onboarding — to catch bad data at entry.
Verify bank details when a payee is created. Invalid or mismatched details are flagged immediately, so they can be corrected before any payment is attempted.- Best for marketplaces, payroll platforms, and onboarding new employees or sellers.
- Before payout — to validate your batch.
Run verification before releasing a payout batch. Invalid accounts are removed upfront, so payments go out clean and exceptions are handled separately.- Best for payroll runs, vendor payments, and scheduled payout cycles.
- On change — to prevent fraud and errors.
Re-verify whenever bank details are updated. This ensures new account details match the intended payee before the next payment is sent. platforms handling bank detail updates or change requests.- Best for platforms handling bank detail updates or change requests.
- Ongoing — to keep your data clean.
Periodically re-verify stored accounts to catch closed, inactive, or changed details before they cause failures.- Best for platforms handling bank detail updates or change requests.
4 Places to layer in pre-validation without rebuilding your stack

How to choose a modern verification provider
There are three things that set modern bank account verification apart from legacy methods: data richness, coverage, and implementation experience.
Each should factor into your decision when choosing which verification method to use in your stack.
Data richness
Data richness determines how actionable the verification is. Whereas legacy methods yield binary valid/invalid results, a real-time API provides all the information needed.
As these two examples demonstrate, the difference is stark:
- Binary response: "We can't pay this."
- Rich response: "The account is closed — here's the correct name registered at the bank, please update the payee's profile."
The table below offers a closer look at what types of data should be provided with a modern solution and how your team can use it to improve results.
What data a modern solution should provide:
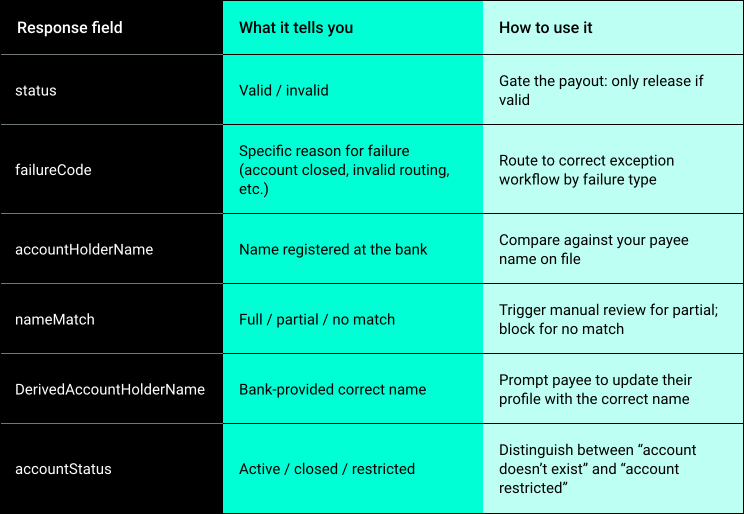
Coverage depth and breadth
Verification is only as strong as the coverage you have, but bank account verification coverage varies by market and method.
When evaluating a provider for depth and breadth of coverage, consider the following dimensions:
- Account existence check. Does the account exist and can it receive funds? Should be available in most major corridors.
- Name match. Does the account holder name match the payee name? Should be available in a growing subset of corridors — e.g. UK (CoP), US (EWS), EU VoP-eligible markets, and select APAC corridors (Malaysia, Singapore PayNow, India UPI, Indonesia, Pakistan, Hong Kong).
- Account status. Is the account active, restricted, or closed? Should be available in select corridors.
A note on prioritizing corridors — focus where you have the highest failure rates and the highest payout volumes. A provider with strong coverage in your specific corridor mix is more valuable than broad geographic coverage with shallow depth.
Implementation simplicity
For teams integrating a bank account verification API for the first time, it's important to choose a provider with a fluid implementation experience from beginning to end.
With Nium Verify, for example, most teams go live in under seven days:
- Day 1: API credentials are issued; sandbox access is activated; API documentation reviewed.
- Days 2-3: First API calls in sandbox; test against mock account values for each corridor; confirm response field handling in codebase.
- Days 4-5: Integration into payout workflow at chosen trigger point (onboarding or pre-flight batch); error handling and routing logic for each response type.
- Days 6-7: QA, testing against edge cases; sandbox signoff.
- Week 2: Production go-live for target corridor; monitor exception rate before/after, ops ticket volume, and re-processing rate.
Typical implementation paths by vertical:
- Payroll & vendor: Start with 1–2 key corridors where failure rates are highest; wire verification into existing batch job.
- Marketplaces: Add verification to seller payout onboarding in 1 region; roll out globally after NPS impact is proven.
- Fintech/remittance: Begin with first-time payouts to new beneficiaries; expand to recurring flows once impact is validated.
Getting started in three steps
1. Know your baseline
Quantify your cost of preventable failures and compare that against your estimated verification cost.
- Monthly preventable failure cost = failures_per_month × %_account_detail_failures × ops_cost_per_exception
- Monthly verification cost = payouts_per_month × cost_per_verification_call
Map where bad data enters and the specific verification trigger (onboarding, pre-flight batch, on-change, hygiene):
- At onboarding?
- In batch uploads?
- Via bank detail change requests?
Meeting three or more of the following criteria almost always justifies making the move to prevention-first:
- You process >5,000 payouts per month.
- ≥30% of your returns are due to account detail issues.
- Your average handling cost per exception is ≥$15.
- You operate in at least one of: UK, US, EU VoP markets, key APAC corridors.
- Payout reliability is part of your product promise (payroll, EOR, marketplace, fintech, remittance).
2. Calculate your savings
Use an ROI calculator to model your failure rate, ops cost, and verification cost across your specific corridors. Input takes two minutes. Output is your business case.
3. Start a pilot
Most teams start with one payout cycle or one corridor. Define a clear before/after metric — exception rate, ops time, re-processing count — and let the numbers make the case.
Getting started is straightforward with the right partner
If you are running recurring payouts to external payees and want to understand what verification coverage looks like for your specific corridors, Nium can help.
Book a 30-minute conversation to learn more about how you can reduce failed payouts by up to 70% with Nium Verify.
Suchi Pattanayakis a Product Director at Nium, where he owns product strategy for account verification and global payouts. With seven years in fintech across Visa andNium, he focuses on making cross-border money movement reliable, fraud-resistant, and operationally efficient.
IIMBangaloreMBA | NIT Rourkela B.Tech.